Housing Starts Report: What to Watch Aug 25, 2026
Comes out: Tuesday, August 25, 2026 at 8:30 a.m. ET
Published by: U.S. Census Bureau
A government report on new home building comes out on Tuesday, August 25, 2026, at 8:30 a.m. Eastern Time. It is called New Residential Construction, and most people just call it housing starts.
A housing start means builders broke ground on a new home. The report counts how many homes they started across the country.
You may not build homes yourself. But this number still touches your life. It shapes how many homes are for sale next year, and that can move prices and rent right here in South Florida.
What this report actually measures
The U.S. Census Bureau counts new homes that builders just started. Starting a home means digging the foundation and beginning the build.
Think of it as a peek at the future. A home started today is not for sale today. It shows up for sale months from now. So today's building tells you about tomorrow's supply.
Supply is just how many homes are available to buy. More homes for sale usually cools prices. Fewer homes for sale usually firms them up.
What the charts show right now
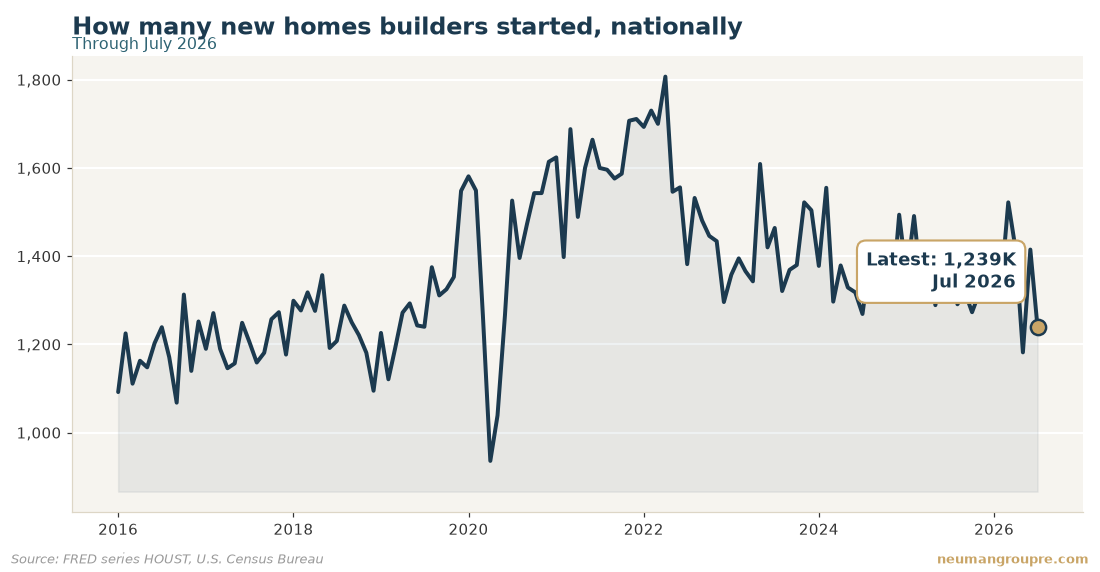
The chart above shows new homes started nationally. The most recent count is 1,239K for July 2026. The K means thousand, so that is about 1,239,000 homes.
That number is down from the month before, which was 1,415K. It is also down from a year earlier, which was 1,432K. So builders started fewer homes than they did last year.
Fewer homes going up now means fewer new homes for sale next year. That is the key idea to hold onto.
Prices in our three counties
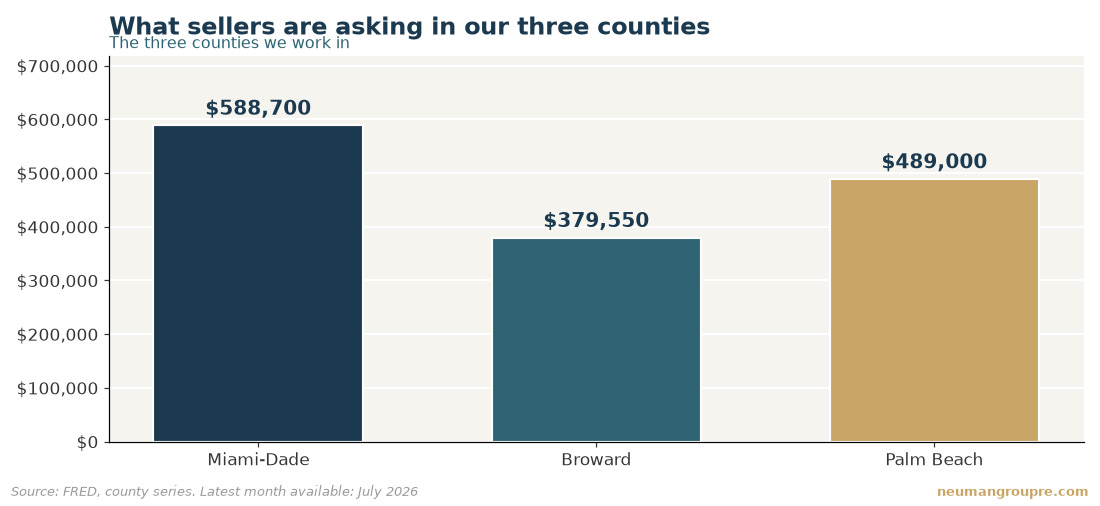
The South Florida chart shows what sellers are asking. In July 2026, the typical asking price was $588,700 in Miami-Dade, $379,550 in Broward, and $489,000 in Palm Beach. All three are down from a year ago.
So building is slowing, and local asking prices have softened a little over the past year.
What it means for your mortgage payment
A mortgage is the loan you use to buy a home. You pay it back every month, with interest. Interest is the extra fee the bank charges for lending you the money.
Housing starts do not set your rate by themselves. But this report is one piece the market watches. When reports point to a weaker economy, rates can drift down. When they point to a stronger one, rates can drift up.
Even a small change in rates matters. On a $600,000 loan, a shift in the rate can add or cut hundreds of dollars from your monthly payment. So it pays to watch where rates are heading before you lock one in.
What it means for home prices
Here is the link between building and price. When builders start fewer homes, fewer new homes reach the market later. Less supply tends to hold prices up.
South Florida asking prices have eased over the past year, as the chart shows. But if building stays slow, that easing may not last. Tight supply can put a floor under prices.
What it means for rent
Rent follows the same rule of supply. Many new homes that get built become rentals. When fewer homes go up, fewer new rentals open.
If you own a place and rent it out, tighter supply can support the rent you charge. If you are the one renting, fewer new units can mean fewer choices and firmer rents.
How to read tomorrow's number
You do not need to guess the figure. Just compare it to the last one, 1,239K. Ask one simple question: did building go up, go down, or stay flat?
The answer tells you which way supply is leaning for next year. That is the part that reaches your wallet.
Have questions about buying, selling, or renting in Miami-Dade, Broward, or Palm Beach? The Neuman Group is here to help at 954-228-5001.
Three things to watch
What sellers are asking in our three counties
| County | Now | A year ago | Direction |
|---|---|---|---|
| Miami-Dade | $588,700 | $600,000 | down |
| Broward | $379,550 | $408,275 | down |
| Palm Beach | $489,000 | $495,000 | down |
County figures from FRED, latest month published: July 2026.
Questions people ask
What are housing starts?
Housing starts count how many new homes builders just began. Beginning a home means starting the foundation and the build. It is a national count from the U.S. Census Bureau.
When does the report come out?
It comes out on Tuesday, August 25, 2026, at 8:30 a.m. Eastern Time. The Census Bureau releases it. It is called New Residential Construction.
Why should a home buyer in South Florida care?
Building today shapes how many homes are for sale next year. Fewer homes started now can mean tighter supply and firmer prices later. That affects what you pay.
Does this report change mortgage rates?
Not by itself. But the market watches it as one clue about the economy. Reports like this can nudge rates up or down over time, which changes your monthly payment.
What was the last housing starts number?
For July 2026, builders started 1,239K homes, which is about 1,239,000. That was down from 1,415K the month before and down from 1,432K a year earlier.
Every figure on this page comes straight from FRED (Federal Reserve Economic Data, Federal Reserve Bank of St. Louis) — series HOUST. We publish these before the report lands so you can read the background while it is still quiet, then we add the actual number here the moment it is out.
Call 954-228-5001 or ask us for a free read on your property.