Miami Unemployment Rate: Sept 2026 Jobs Report Explained
Comes out: Wednesday, September 2, 2026 at 10:00 a.m. ET
Published by: U.S. Bureau of Labor Statistics
A new jobs report for our area comes out on Wednesday, September 2, 2026, at 10:00 a.m. Eastern time. It comes from the U.S. Bureau of Labor Statistics, the government office that counts who is working and who is not.
This one is close to home. It shows the unemployment rate for the Miami-Fort Lauderdale-West Palm Beach area, and for Miami-Dade, Broward, and Palm Beach one by one.
Why should you care? Jobs are what let people pay rent and qualify for a mortgage. So this number quietly shapes home prices, rent, and how easy it is to buy here.
What this report actually measures
The unemployment rate is simple. It is the share of people who want a job and are looking for one, but do not have one yet. A lower rate means more people are working. A higher rate means more people are out of work and still searching.
This report breaks that number down by metro area and by county. So it does not just cover the whole country. It covers our three counties on their own. That is why it matters for housing right here.
What the charts show right now
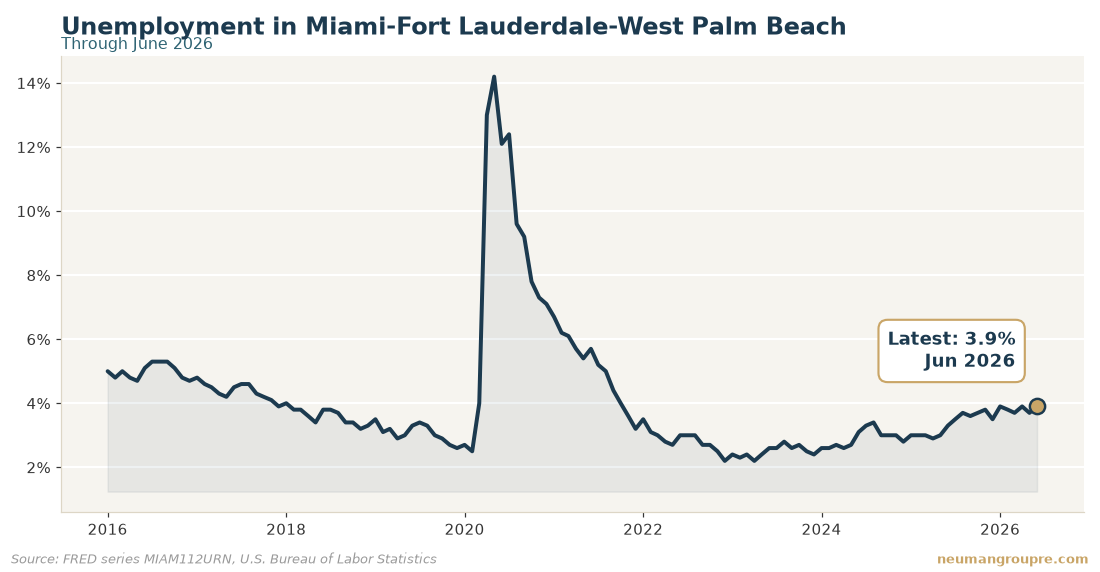
The chart above shows the unemployment rate for the Miami-Fort Lauderdale-West Palm Beach area. The most recent reading is 3.9% for June 2026. The month before, it was 3.7%. A year ago, it was 3.3%. So the rate has moved up, both from last month and from a year ago.
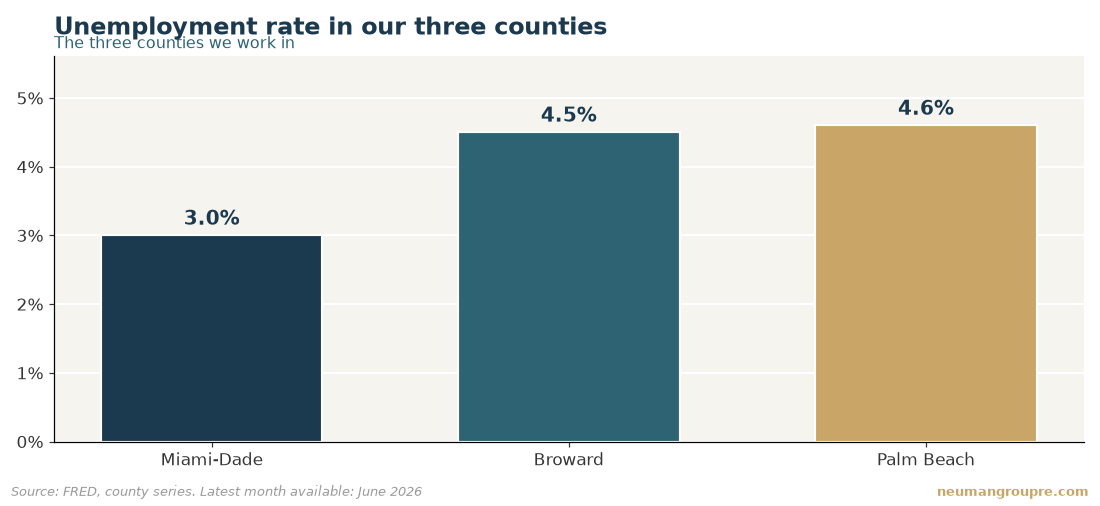
The county chart shows the same picture split three ways. In June 2026, Miami-Dade was at 3.0%. Broward was at 4.5%. Palm Beach was at 4.6%. All three are higher than a year ago, when Miami-Dade was 2.6%, Broward was 3.7%, and Palm Beach was 3.9%.
These are still low numbers by past standards. But the direction is up. That is the part to keep an eye on.
What it means for your mortgage payment
This report does not set your mortgage rate by itself. But it shapes the mood of the people who do. When more people are out of work, lenders and investors often expect interest rates to ease over time. When lots of people are working and spending, rates can stay higher for longer.
Here is why that matters. On a $600,000 loan, even a small change in your interest rate changes what you pay every month. Over 30 years, that adds up to real money. So a report that hints rates may fall could help buyers. A report that points the other way keeps payments where they are.
What it means for home prices and rent
Home prices lean on how many people can afford to buy. Steady hiring means more buyers with reliable paychecks. That supports prices. If the rate keeps drifting up, some buyers pull back, and price growth can cool.
Rent works in a similar way. If you rent out a place, you need tenants who earn enough to pay each month. When local jobs are steady, rent tends to hold. When work gets shaky, some renters double up or move, and a unit can take longer to fill.
None of this happens overnight. One month does not make a trend. But this county-level report is one of the clearest reads on who can buy and rent here.
What to watch on Wednesday
The new numbers land on Wednesday, September 2, 2026, at 10:00 a.m. Eastern time. Watch two things. First, did the metro rate stay near 3.9%, or did it move? Second, did all three counties keep drifting up, or did one turn back down?
Do not read too much into one month. Numbers get revised later as more data comes in. Look at the trend over several months instead. The chart above makes that trend easy to see at a glance.
Three things to watch
Unemployment rate in our three counties
| County | Now | A year ago | Direction |
|---|---|---|---|
| Miami-Dade | 3.0% | 2.6% | up |
| Broward | 4.5% | 3.7% | up |
| Palm Beach | 4.6% | 3.9% | up |
County figures from FRED, latest month published: June 2026.
Questions people ask
When does the Miami unemployment report come out?
It comes out on Wednesday, September 2, 2026, at 10:00 a.m. Eastern time. It is published by the U.S. Bureau of Labor Statistics.
What is the current Miami-area unemployment rate?
The most recent reading is 3.9% for June 2026. That covers the Miami-Fort Lauderdale-West Palm Beach area. It was 3.7% the month before and 3.3% a year ago.
Which South Florida county has the highest unemployment rate?
In June 2026, Palm Beach was highest at 4.6%. Broward was 4.5%. Miami-Dade was lowest at 3.0%. All three are higher than a year ago.
Does the jobs report change my mortgage rate?
Not directly. It does not set rates. But it shapes what lenders and investors expect. Weaker hiring can point to lower rates over time, while strong hiring can keep rates higher for longer.
How does unemployment affect home prices and rent here?
Jobs are what let people afford to buy and rent. Steady work supports home prices and keeps rent stable. Rising unemployment can cool price growth and make units slower to fill.
Every figure on this page comes straight from FRED (Federal Reserve Economic Data, Federal Reserve Bank of St. Louis) — series MIAM112URN. We publish these before the report lands so you can read the background while it is still quiet, then we add the actual number here the moment it is out.
Call 954-228-5001 or ask us for a free read on your property.